
Project Overview: From Paper Records to a Unified Digital Production Platform
MES for beverage manufacturing was the core of a digital transformation project delivered by BAP at a beverage plant in Vietnam. The plant has operated since 2010, with three product lines and 24 fermentation tanks running in parallel. Before the project, production data was recorded mostly on paper or kept in standalone software. That made it hard to compile reports, trace information and monitor the whole plant. To solve this, BAP implemented an integrated MES for beverage manufacturing platform combining MES, LIMS, CMMS, ERP and BI, together with five AI assistants. The platform connects data, standardizes processes and supports decisions based on production data. It is live, and the plant’s workshops use it every day.
Project at a Glance
- Scope: 8 departments and workshops across the entire plant
- Scale: 17 software modules, 674 specified functions
- Effort: 132 person-months of design and development
- Status: live and in daily operation
1. The Challenge: Production Data Spread Across Paper and Disconnected Systems
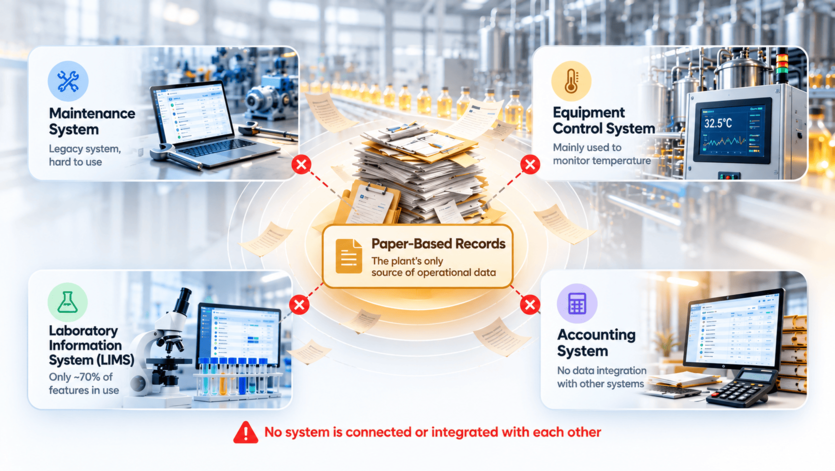
180 Paper Forms in Daily Operations
Workshop data was captured mainly in batch logs, shift handover books, equipment inspection sheets and sanitation logs. Each department then compiled these records into Excel in its own way. Different form structures and recording methods made it difficult to reconcile figures across shifts and workshops. Paper records were also hard to search and at risk of being lost or damaged over time. To review the history of a single batch, staff had to dig through several documents instead of querying one central source.
Four Disconnected Software Systems
The plant already used several tools, but none of them shared data:
- Maintenance software: an older-generation system that is hard to use.
- Equipment control system: used mainly to monitor temperature.
- Laboratory software: only about 70% of its features were in use.
- Accounting software: not connected to any other system.
Each tool met part of the need, but information was not shared automatically between departments. This created problems on three levels:
- On the production floor: operators spent time on writing, data entry and handovers, and data could be missing or inaccurate after several manual steps.
- At the management level: managers struggled to see production, inventory and equipment status when away from the plant, and reports depended on compiling several sources.
- At the data level: equipment incident history, material consumption and test results were not linked, so root-cause analysis, performance review and maintenance planning were limited.
Root Cause: No Single Source of Operational Data
The plant did not lack tools. The real bottleneck was that daily data was not digitized, standardized or linked in a common structure. Simply adding more software would have created new data silos. So BAP started by understanding how the plant operates, and by defining how data should be created, validated, shared and used across it.
2. Approach: Standardize Operations Before Building the System
MES for beverage manufacturing is only useful when it reflects what actually happens on the floor. BAP surveyed 8 departments and workshops on site, reviewed 180 paper forms and standardized 8 handover reports. Each department went through the same six-step analysis:
- As-Is: document current processes, forms, data and cross-department coordination.
- Bottleneck: identify steps that cause delays, duplicate data entry or prevent cross-checking.
- To-Be: design how operations should work after digitization.
- Solution Mapping: match each business process with the system functions that support it.
- Data Integration: define which data must be shared between modules.
- Validation Rules: set input checks to keep data consistent.
Digitizing the Entire Production Chain
The survey covered the main stages: raw materials, brewing, fermentation, filtration, filling, finished goods warehouse and sales. Supporting activities (quality testing, CIP cleaning, equipment maintenance and utilities) were reviewed in relation to the production line. 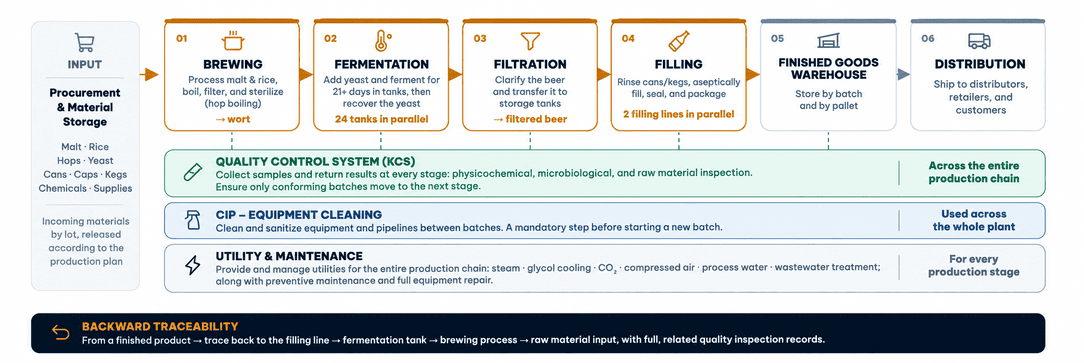 For example, to trace a finished batch, the system must link the filling shift, fermentation tank, brew, raw material inputs and related test results. This is the foundation for moving from managing each stage separately to managing data across the full production lifecycle.
3. The Solution: MES for Beverage Manufacturing Integrated with LIMS, CMMS and ERP
BAP designed a shared data platform that integrates MES, LIMS, CMMS and ERP with a BI dashboard and five AI assistants. This architecture connects data between workshops and management, replacing operations built on standalone software. 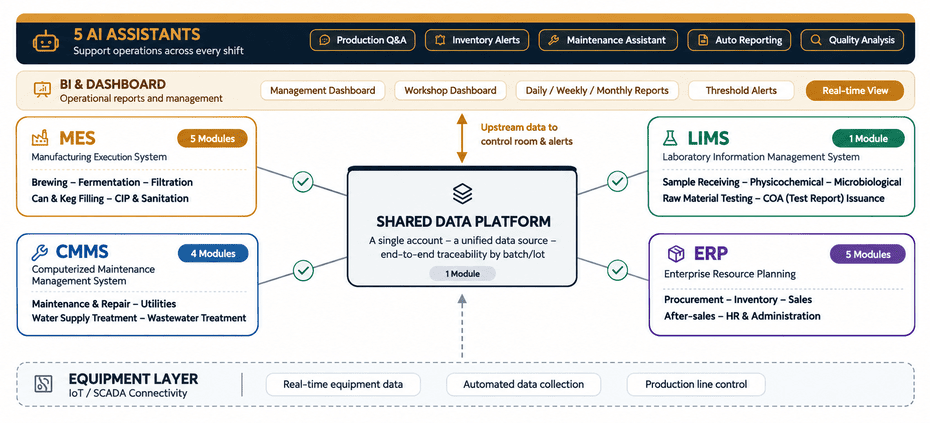
MES: Manufacturing Execution System
In this MES for beverage manufacturing, the MES module digitizes and manages each production stage:
- Brewing: tracks brews, raw materials and process parameters.
- Fermentation: manages the fermentation process and data for each tank.
- Filtration: records filtration and the transfer of semi-finished product.
- Filling: manages can and keg filling and finished-batch information.
- CIP cleaning: records equipment and pipeline cleaning.
Data is organized by brew, batch and shift. This supports progress tracking, material consumption control and traceability across the production process.
LIMS: Laboratory Information Management
LIMS covers quality-related work: sample receipt, physicochemical and microbiological testing, incoming material inspection, and management and release of test results. Linking test data with production data supports quality traceability by brew and batch.
CMMS: Maintenance and Equipment Management
CMMS covers four areas: maintenance and repair, utilities, water supply treatment and wastewater treatment. It keeps equipment history, maintenance plans and incident records in one place.
ERP: Enterprise Resource Planning
ERP connects production with purchasing, warehouse management, sales, after-sales, administration and HR. Material, finished-goods and business information can then be managed alongside production data.
BI and Dashboards: Data-Driven Management
BI and dashboards give leadership and each workshop daily, weekly and monthly reports, plus alerts when data exceeds thresholds. Instead of waiting for departments to compile figures by hand, managers can access information from the shared platform within their permissions.
4. Project Scale: 674 Functions Specified in Detail
To cover the whole plant, the MES for beverage manufacturing project was broken down into 17 software modules with 674 functions: 564 mandatory and 110 optional. The work was also divided into 19 items for estimation. Total design and development effort is 132 person-months. 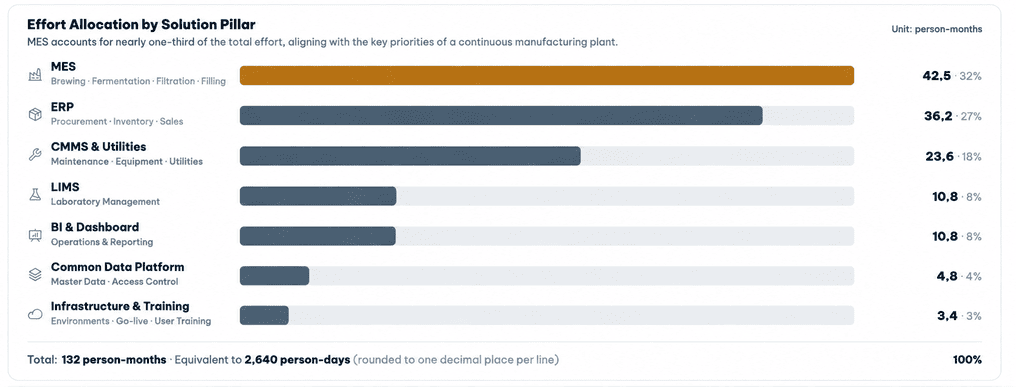 MES accounts for nearly one-third of the total effort, reflecting the level of detail required in a continuous manufacturing plant. Breaking functions down by business area also clarified scope, set priorities and kept development under control. Note: component figures are rounded to one decimal place.
5. Technical Architecture of MES for Beverage Manufacturing: From Shop Floor to Management
BAP designed the solution on a five-layer architecture. It connects data from production equipment and workshop activity to management systems and cloud infrastructure, creating a base for collecting, processing, storing and using data across the plant. The layered design is consistent with the ISA-95 approach to integrating manufacturing execution systems with enterprise systems.
- Layer 1, shop-floor data capture: staff can work from workshop computers, tablets, technicians’ phones, or by scanning batch and pallet codes. Equipment data is connected through IoT/SCADA within the design scope.
- Layer 2, application: a web interface across devices, and a mobile app for maintenance and on-site tasks.
- Layer 3, business logic and integration: connects MES, LIMS, CMMS and ERP. It handles role-based access, approval workflows, input validation, threshold alerts, batch and lot traceability, and report generation.
- Layer 4, data management and storage: a relational database, caching, and file and report storage, with automatic daily backups designed to protect and restore data.
- Layer 5, cloud infrastructure: load balancing, multi-zone redundancy, a separate test environment, and monitoring and alerting.
The design targets the 99.99% availability committed by the cloud provider. This is an infrastructure figure from the design, not a separate BAP SLA.
Designed for the People Who Use It Every Day
A key principle was to keep data-entry screens close to the paper forms operators already know. Field order and business terminology follow what happens on the floor, which narrows the gap between working on paper and working in the system. In a plant with many long-serving staff, this helps the move from manual records to digital entry.
6. AI Applications: Using Standardized Data
AI works well only when its input data is consistent, has context and can be traced. In this project, five AI assistants read from the same production data rather than from separate data stores.
- Production Q&A assistant: lets managers query shift, brew, batch and performance data in natural language. Example: “Compare this month’s filling performance with last month.”
- Inventory alert assistant: combines inventory and production plans to flag possible material shortages. Example: “Can stock is enough for 6 days of production under the current plan.”
- Maintenance assistant: uses equipment and incident history to help technicians spot issues that need attention. Example: “This machine has failed with the same fault 3 times in 6 months.”
- Automated reporting assistant: compiles data by shift, day or month and helps identify unusual variations. Example: “Last night’s shift exceeded the consumption norm by 4%.”
- Quality analysis assistant: links test, material and production data to suggest hypotheses for abnormal results. Example: “The defective batches all used the same raw material lot.”
These examples illustrate how the assistants are used. For quality issues, the final conclusion still needs confirmation by a qualified person. All five assistants share one data source, with batch, lot and shift identifiers consistent with the business systems and dashboards.
7. Results and Operational Value
The MES for beverage manufacturing is live and used daily by the plant’s workshops. The notable outcome is the reorganization of processes and operational data across the whole plant, in place of managing information through separate forms and software. The platform is designed to support:
- Less manual work: data is entered once at the source and reused across business processes.
- Stronger traceability: production, material and quality information is linked by brew, batch and shift.
- Better monitoring: dashboards bring information together for production management and operations.
- Maintenance support: equipment and incident history is organized for analysis.
- A base for AI: standardized data can be used by AI assistants for each business function.
Indicators Used to Measure Impact
The indicator set below shows the dimensions a manufacturer can use to evaluate the return on an MES: productivity, information turnaround time, traceability and production quality. 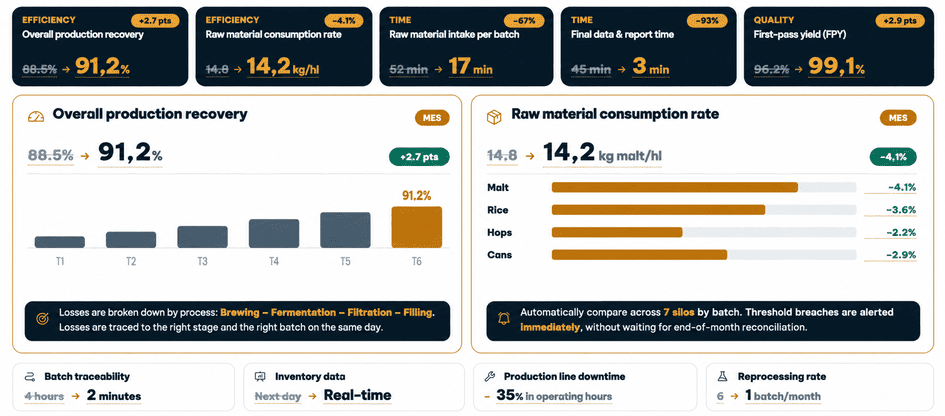 Note: figures shown are illustrative samples, not verified customer measurements.
8. Lessons Learned: Standardizing Operations Is the Foundation of Digital Transformation
Understand the Operation Before Choosing an MES for Beverage Manufacturing
Surveying each workshop, process and form shows exactly which data must be digitized, who is responsible and where the information is used.
Build Unified Data Instead of Adding Standalone Software
MES, LIMS, CMMS and ERP serve different purposes, but the value of an integrated architecture lies in the data connections between them.
Apply AI After Data Is Standardized
AI does not replace the need for a solid data foundation. Once production information is organized in a unified structure, a business is better placed to deploy Q&A, alerts and analysis.
9. BAP: Your Partner from Survey to Operation
BAP delivers MES for beverage manufacturing end to end: current-state survey, business analysis, architecture design, software development, infrastructure, training and operational support. For factory digital transformation, BAP focuses on fitting the technology to real production conditions, not applying one fixed software model to every business. Explore more BAP solutions and other case studies.
Still Managing Production with Paper, Excel or Disconnected Systems?
Talk to BAP to assess your current state, identify data bottlenecks and build a digitization roadmap that fits the size of your plant.